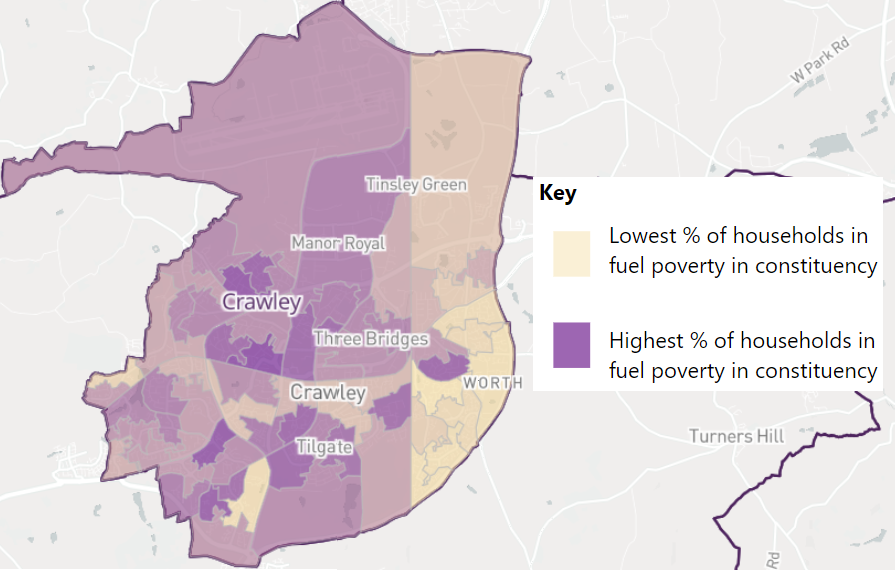
My attention was recently drawn to a new data release by the House of Commons Library on ‘fuel poverty’. The first thing to note is that fuel poverty in this case is not actually directly about a household’s ability to afford their energy bill, but rather a house’s energy rating, the lower the energy rating the greater the ‘fuel poverty’ (ratings D, E, F and G are all considered to be fuel poor).
Despite this, at first glance, the wealthier parts of the town do appear to be those with the lowest fuel poverty. However, when we look at the map LSOA by LSOA we realise that this is an indirect relationship, with the map to a large extent representing the time at which each type of housing was build, the more recently built the housing the greater the energy rating, with the fuel poor parts of Pound Hill being the housing built by the New Towns Commission (and actually some a bit earlier, between the Wars, around the northern-end of Pearson Road), while the rest built much later.
So, why the apparent wealth disparity? Simply put, the obligations put upon developers to provide affordable housing decreased substantially over the time the New Town was built, with essentially no affordable housing at all by the time Maidenbower was given permission (while I haven’t looked this up, I was told by older colleagues that the Secretary of State had to intervene on Maidenbower as the council wouldn’t grant permission for it to be built without council housing, this is one of the reasons why despite Crawley being poorer than much of West Sussex as a whole Maidenbower is actually the wealthiest division in West Sussex). As a result, even after the sell off of large volumes of council housing, older parts of the town are more likely to both be less wealthy and have a lower energy rating.
While this relationship is more pronounced in Crawley due to the history of the town’s development, I suspect that the way most large towns/cities develop with centrally-located properties increasingly being privately rented and wealthier residents moving to the outskirts to access larger and greener properties, that a similar relationship can be found across the UK. The end result is that not only is insulating Britain an important measure for addressing the Climate Emergency and ensuring the UK national energy security, but it’s a social measure too, helping to close the gap in energy costs between poorer and wealthier households.
It’s worth noting that the map above compares parts of Crawley to other parts of Crawley, not the UK as a whole. When viewed in the national context, the young age of the New Town actually means we perform quite well, with only 8.2% of properties being deemed fuel poor, compared to 13.2% in England as a whole.
As Crawley’s biggest landlord, still directly owning between a fifth and a quarter of Crawley’s housing, in addition to being the freeholder of much of the town’s flats, Crawley Borough Council clearly has a major role to play and we have already been working with the University of Southampton for some years to identify how we can deliver Net Zero Crawley Homes in-line with the deadlines set out in our local and national commitments.
The money we’re talking about is vast, but given that social housing providers have the advantages of existing budgets for undertaking replacements and improvements over time and the benefit of scale, the challenge is not insurmountable. The more significant question is how we can ensure that sufficient improvement works are undertaken to privately-owned properties in time. For that we need a Green Prosperity Plan and a Labour Government to deliver it.
Discover more from Peter Lamb for Crawley
Subscribe to get the latest posts sent to your email.
